

The Cardboard Index: What Boxes Tell You That GDP Won’t
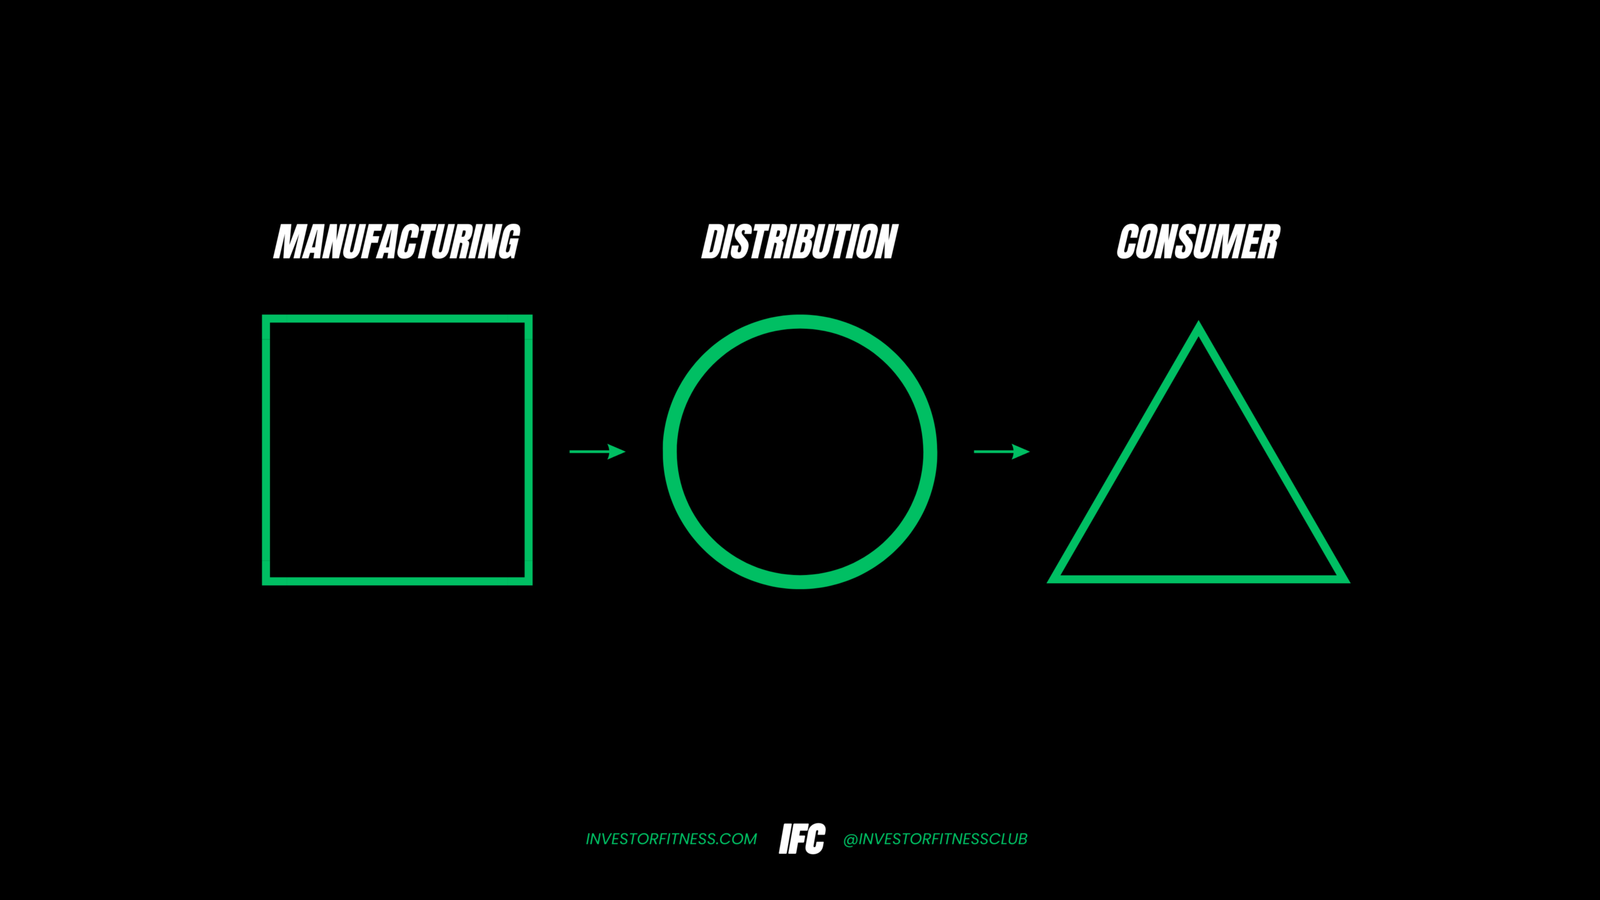
Every physical product on earth touches a box before it touches you.
From Mining to Manufacturing to Distribution to Home.
Cardboard demand can’t be faked — no Packaging manufactures produce Cardboad boxes speculatively. It gets ordered because a real product is moving through a real supply chain. That makes it one of the cleanest, hardest-to-manipulate readings of an economy’s actual physical output that exists.
Here’s what six decades of data across three economies actually shows.
USA: A 32-year mirror, then a clean break
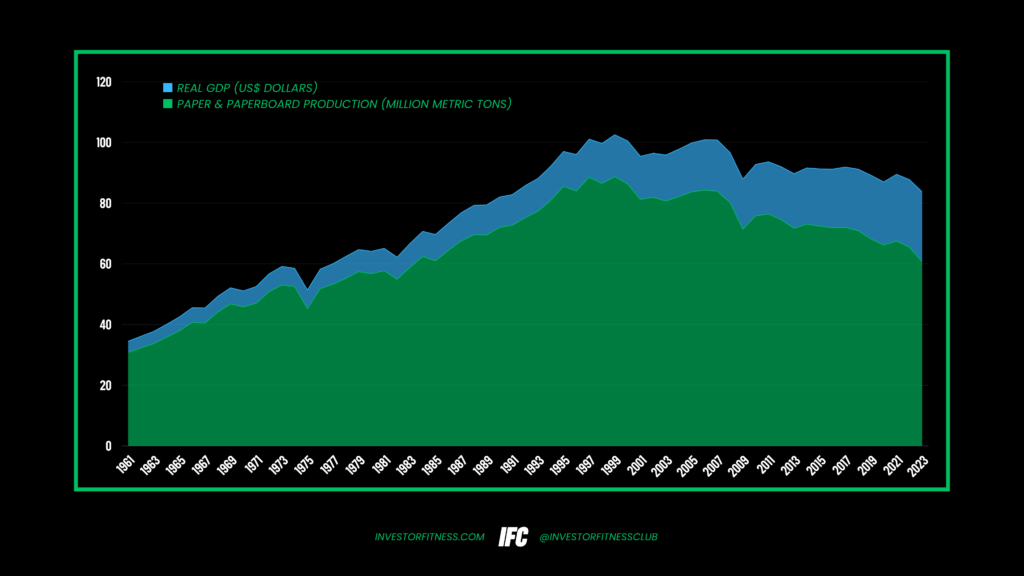
From 1961 to 1999, US paperboard production tripled — 30.8 million metric tons to a record 88.7 million. GDP climbed in near-lockstep the entire time. Every single downturn in that stretch lines up exactly with a recognized recession: the 1973–75 oil shock (-14%), the 1981–82 Volcker recession (-5%). Cardboard and GDP were telling the same story.
1999 is where the story splits. GDP never stopped climbing — it’s up 6.2x since 1961. Paperboard production peaked that year and has fallen ever since, down 32% by 2023, through the dot-com bust, the 2008 financial crisis, and a fresh post-pandemic destocking drop in 2022–23.
The takeaway: China’s WTO entry in 2001 and two decades of offshoring hollowed out US manufacturing while GDP kept rising on services, finance, and software. Cardboard tracks the goods economy. GDP tracks the whole economy. When they split, that split is the signal — years before it shows up in a jobs report.
China: The mirror image of America
China produced 14 million metric tons of paper and paperboard in 1992. By 2007 it hit 73.5 million. By 2021, 125 million — the largest producer on earth, more than double the US. GDP moved the same direction the entire time: $360B in 1990 to $18.7 trillion by 2024, a 52x expansion.
This is what the US chart looked like in its 1961–1999 phase, except bigger and faster — an economy still built on making and exporting physical goods, where cardboard and GDP move as one signal, not two.
One flag worth knowing: China’s own 2024 production number is contested between sources — FAO reports 140 million metric tons, China’s National Bureau of Statistics reports 158.5 million for “machine-made paper and paperboard.” Different classification systems, not a typo. Cite whichever source you use, by name — don’t average them.
India: Still in the buildout phase
India’s per-capita packaging consumption doubled in a decade — 4.3 kg/person in 2010 to 8.6 kg in 2020 (Indian Institute of Packaging). GDP nearly doubled over the same stretch: $1.71T to $2.67T. Post-2020, both accelerated together — GDP to $3.9T by 2024, packaging paperboard now a 15-million-tonne segment growing 8.2% a year (IPMA), turbocharged by e-commerce in a way neither the US nor early China ever had.
India doesn’t have a public decade-by-decade cardboard series the way the US does — only a handful of verified data points exist. But every one of those points moves the same direction as GDP. No divergence yet. That’s the signature of an economy still in its industrial buildout — the US pattern before 1999, not after.
The rule
Cardboard tracks the goods economy — manufacturing, trade, retail, logistics. GDP tracks the whole economy, goods and services combined.
- When the two move together (China throughout, India today, the US pre-1999): growth is physical. Factory jobs, export revenue, industrial capacity are being built.
- When they split (the US post-1999): GDP is still climbing, but the physical economy underneath it is shrinking — a warning sign that shows up in cardboard years before it shows up anywhere else.
Next time a GDP print gets called a “boom,” there’s one question that cuts through the noise: how much cardboard did that economy use this year?
Sources
- US paperboard production 1961–2023 & real GDP (GDPC1): FAO/Statista; BEA via FRED
- China production anchors (1992–2024) & GDP (2021–2024): FAO/Statista, China Paper Association, World Bank via Macrotrends
- India GDP (1987–2023): IMF WEO via Statistico, cross-checked against World Bank/FRED
- India packaging data: Indian Institute of Packaging; Indian Paper Manufacturers Association
Full data tables with every source cited line-by-line are in the companion sheet.